Statistics for Undergraduate Studies
Uni ePrep Course
at SkillsFuture@NS

In today’s data-driven world, the ability to analyze and make sense of data is more important than ever before. That’s why statistics has become a critical subject for undergraduates to master. Whether you’re studying business, economics, social sciences, or any other field, a solid understanding of statistics is essential for success.
Many universities now require students to take one or more courses in statistics as part of their undergraduate programs. This is because statistics provides a powerful framework for understanding and interpreting data, and it is used in virtually every field of study.
However, it’s no secret that statistics can be a challenging subject for many students. But with the right resources and guidance, anyone can master the skills needed to succeed in statistics. By developing a solid foundation in statistics, you’ll be equipped with the tools and knowledge necessary to make informed decisions and solve complex problems.
In addition, studying statistics can enhance your critical thinking skills and make you a more valuable asset to potential employers. As the demand for data-driven decision making continues to rise, employers are seeking individuals with strong statistical skills who can analyze data, identify trends, and make informed decisions.
So, if you’re an undergraduate student looking to succeed in your chosen field, consider studying statistics now to better prepare for your undergraduate studies. With the right resources, guidance, and dedication, you can overcome the challenges and reap the many benefits that come with mastering this important subject through this course. Don’t miss out on this valuable opportunity to gain a competitive edge in today’s data-driven world.
This Statistics course was developed in collaboration with Cengage, the publishers of the popular probability and Statistics textbook by Mendenhall, Beaver and Beaver. In addition to providing this textbook at no additional cost, this Statistics for Undergraduate Studies ePrep course also comes with excellent eLearning materials including video lessons, powerpoints, solutions to all questions in textbook, online exercises etc, provided by the book publishers, Cengage.
Statistics for Undergraduate Studies is one of the ten ePrep courses, specially developed by NTU, to help NSFs, NSMen, and others, to better prepare for their university studies, whether in Singapore or overseas.
In this course, there is also a retired NTU professor acting as a personalized tutor. He will be happy to answer any queries or questions the students may have, not only during the course but until the students enter the universities and have their own tutors.
Please note that this course, as well as the other ePrep courses provided by NTU, will soon be available at SF@NS LXP, the SkillsFuture@NationalService Learning eXperience Platform.
Statistics for Undergraduate Studies
Learning Contents
I. Compulsory Chapters
Ch 1 Describing Data with Graphs
1.1 Variables and Data
1.2 Types of Variables
1.3 Graphs for Categorical Data 11 Exercises
1.4 Graphs for Quantitative Data
Pie Charts and Bar Charts
Line Charts
Dotplots
Stem and Leaf Plots
Interpreting Graphs with a Critical Eye
1.5 Relative Frequency Histograms
Ch 2 Describing Data with Numerical Measures
2.1 Describing a Set of Data with Numerical Measures
2.2 Measures of Center
2.3 Measures of Variability
2.4 On the Practical Significance of the Standard Deviation
2.5 A Check on the Calculation of s
2.6 Measures of Relative Standing
2.7 The Five-Number Summary and the Box Plot
Ch 3 Describing Bivariate Data
3.1 Bivariate Data
3.2 Graphs for Categorical Variables
3.3 Scatterplots for Two Quantitative Variables
3.4 Numerical Measures for Quantitative Bivariate Data
Ch 4 Probability and Probability Distributions
4.1 The Role of Probability in Statistics
4.2 Events and the Sample Space
4.3 Calculating Probabilities Using Simple Events
4.4 Useful Counting Rules (Optional)
4.5 Event Relations and Probability Rules
Calculating Probabilities for Unions and Complements
4.6 Independence, Conditional Probability, and the Multiplication Rule
4.7 Bayes’ Rule (Optional)
4.8 Discrete Random Variables and Their Probability Distributions
Random Variables
Probability Distributions
The Mean and Standard Deviation for a Discrete Random Variable
Ch 5 Several Useful Discrete Distributions
5.1 Introduction
5.2 The Binomial Probability Distribution
5.3 The Poisson Probability Distribution
5.4 The Hypergeometric Probability Distribution
Ch 6 The Normal Probability Distribution
6.1 Probability Distributions for Continuous Random Variables
6.2 The Normal Probability Distribution
6.3 Tabulated Areas of the Normal Probability Distribution
The Standard Normal Random Variable
Calculating Probabilities for a General Normal Random Variable
6.4 The Normal Approximation to the Binomial Probability Distribution (Optional)
Ch 7 Sampling Distributions
7.1 Introduction
7.2 Sampling Plans and Experimental Designs
7.3 Statistics and Sampling Distributions
7.4 The Central Limit Theorem
7.5 The Sampling Distribution of the Sample Mean
Standard Error
7.6 The Sampling Distribution of the Sample Proportion
7.7 A Sampling Application: Statistical Process Control (Optional)
A Control Chart for the Process Mean: The x Chart
A Control Chart for the Proportion Defective: The p Chart
Ch 8 Large-Sample Estimation
8.1 Where We’ve
8.2 Where We’re Going—Statistical Inference
8.3 Types of Estimators
8.4 Point Estimation
8.5 Interval Estimation
Constructing a Confidence Interval
Large-Sample Confidence Interval for a Population Mean mu
Interpreting the Confidence Interval
Large-Sample Confidence Interval for a Population Proportion p
8.6 Estimating the Difference between Two Population Means
8.7 Estimating the Difference between Two Binomial Proportions
8.8 One-Sided Confidence Bounds
8.9 Choosing the Sample Size
II. Optional Chapters
- Large-Sample Tests of Hypotheses
- Inference from Small Samples
- The Analysis of Variance
- Linear Regression and Correlation
- Multiple Regression Analysis
- Analysis of Categorical Data
- Non-Parametric Statistics
For complete listing of detailed topics, see here
Statistics for Undergraduate Studies
What You Get in this University Preparation ePrep Course
I. Free Textbook
“Introduction to Probability & Statistics” is a very popular introductory probability and statistics textbook, authored by Mendendall, Beaver and Beaver, 14th Ed.
II. Free Consultation
A retired NTU professor is acting as the tutor. You can consult him via email or WhatsApp.
III. Materials Online
1 Notes, video lessons and PowerPoint files.
2 Answers/solutions to all questions/problems in the textbook.
3 Online exercises.
4 Problems and solutions in files.
5 Bonus learning materials in algebra, geometry, and trigonometry, and economics
IV. Digital Certificate
A digital certificate will be issued if you have successfully completed the course and passing all the tests at the end of each of the ten compulsory chapters.
Statistics for Undergraduate Studies
Samples of Course Materials
1. Video Lesson (Z-Scores)
This short video lesson discusses z-score which is the number of standard deviations from the mean and provides an illustrative example of its usefulness.
2. Video Lesson (Estimation of Standard Deviation)
This short video lesson discusses z-score which is the number of standard deviations from the mean and provides an illustrative example of its usefulness.
3. Question and Answer (Random Sampling)
Question: A psychology professor has received a grant to examine the association of words occurring within a given distance of each other in everyday prose writing. One way of attracting students to participate in this studywould be to advertise for volunteers with an offer to pay $10 an hour for participants. Would you consider students selected using this mechanism to comprise a random sample? Why or why not?
Answer: Although the mechanism used by the professor does not constitute a true random sample, the students selectedusing this method will probably behave like a random sample. The fact that they are being paid to participate should not cause their responses to the experiment to be substantially different from the responses of a randomly selected group of students.
4. Multiple Choice Question Exercise (Normal Distribution)
Question: Which of the following correctly describes the normal probability distribution?
(a) It is single-peaked above the random variable’s mean, median, and mode, all of which are equal to one another.
(b) It is perfectly symmetric about this peaked central value and, thus, said to be bell-shaped.
(c) It features tails extending indefinitely in both directions from the center, approaching (but never touching) the horizontal axis, which implies a positive probability for finding values of the random variable anywhere between minus infinity and plus infinity.
(d) All of the above.
(e) None of the above
Answer: (d)
5. Problem with Solution (Point Estimation)
Question: If a mental health agency would like to estimate the percentage of local clinic patients that are referred to their counseling center to within 5 percentage points with 90% accuracy, how many patient records should be sampled?
Solution: Maximum variation occurs when p = .5 Since 90% accuracy is involved, solve
1.645 √(pq/n)=.05,
1.645√((.5)(.5)/n)= .05,
√n = 1.645(.5) /.05 =16.45,
n= 270.6
271 patient records should be sampled.
Samples of Bonus Materials beyond Statistics
1. Economics (Evaluating the Market Equilibrium
- Buyers who value the product more than the equilibrium price will purchase the product; those who do not will not purchase the product.
- In other words, the free market allocates the supply of a good to the buyers who value it most highly, as measured by their willingness to pay.
- Sellers whose costs are less than the equilibrium price will produce the product; those whose costs are higher will not produce the product.
- In other words, the free market allocates the demand for goods to the sellers who can produce it at the lowest cost.

- At any quantity of output smaller than the equilibrium quantity, the value of the product to buyers is greater than the cost to sellers so total surplus would rise if output increases.
- At any quantity of output greater than the equilibrium quantity, the value of the product to buyers is less than the cost to sellers so total surplus would rise if output decreases.
3. Note that this is one of the reasons that economists believe the principle: Markets are usually a good way to organize economic activity.
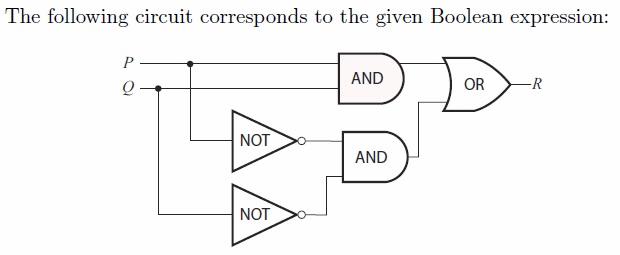
2. Discrete Mathematics (Logic Circuit)
Question:

Solution:
Remarks
As you prepare for further academic studies or career advancement, it’s important to remember not to short-change yourself by settling for low-grade courses prepared by unqualified individuals. You deserve a high-quality education that will give you a competitive edge and set you up for success.
That’s why we highly recommend the Statistics for Undergraduate Studies e_prep course by NTU. This course is specially designed to give you a head start in university or your career by providing you with a comprehensive understanding of probability and statistics. With this course, you’ll have access to a wealth of materials on many other subjects as well, making it a valuable investment in your education.
It’s important to note that even if you’re granted an exception from a module in statistics, you should still take this course and perform well to get a good GPA. Your academic performance is among your highest priorities while in university, and mastering statistics is essential for success in many fields.
By enrolling in this course, you’ll also receive a hard copy Introduction to Probability and Statistics textbook, ensuring that you have all the resources you need to succeed. Plus, with personalized tutoring from a retired NTU professor, you’ll have access to expert guidance and support every step of the way.
So, don’t settle for anything less than a high-quality academic course like this one. Invest in your future by mastering probability and statistics and gaining the skills and knowledge you need to succeed in university and beyond. With the Statistics for Undergraduate Studies e_prep course by NTU, you’ll be well on your way to achieving your academic and career goals.
Who should take this Statistics University Preparation Course?
Whether you are a student studying data science, computer science, psychology, sociology, economics, health care, politics, or engineering, mastering statistics is an essential part of your academic journey. But let’s face it – statistics is one of the most difficult disciplines to fully comprehend. Many students struggle to grasp the concepts of probability and statistics, and this can hold them back from achieving their academic and career goals.
That’s where the Statistics for Undergraduate Studies e_prep course by NTU comes in. This course is designed to help you master the concepts of probability and statistics, giving you the foundation you need to excel in your field. With personalized tutoring from a retired NTU professor and a hard copy Introduction to Probability and Statistics textbook, you’ll have all the resources you need to succeed.
But even if you’re not planning to attend university, this course is still a valuable opportunity for you to prove your capabilities and gain a university-level education. Everyone is welcome to enroll, and there are no pre-requisites required.
Don’t let statistics hold you back from achieving your academic and career goals. Enroll in the Statistics for Undergraduate Studies e_prep course by NTU today and gain the skills and knowledge you need to succeed. Whether you’re planning to attend university or not, this course is an invaluable investment in your education and future.
How to Sign Up for this Statistics University Preparation Course
1 NSF/NSMen
After activating your SF@NS LXP Account at https://go.gov.sg/activatesfnslxp, sign up at SF@NS LXP (SkillsFuture@NationalService Learning Experience Platform) for this Statistics course and other courses by NTU that help you to better prepare for your university studies. There is no limit on the number of courses you can sign up for. For those who still have ePREP credits you may apply via NS portal as in the past but you have credits enough for just one course.
2 Non-NS Folks
Please sign up with NTU PaCE directly. The course fees is S$342.40. Please note that if you reside outside Singapore, you may have to pay for the postage of the textbook.
Course Duration
The official duration of the course is three months but may be extended upon request. Unofficially, however, the support by the tutor extends beyond the official course period. Also, most of the course materials can be downloaded for later study.
Like it? Please share this page about Statistics for Undergraduate Studies ePrep course with your friends.
email: PaCE@NTU.edu.sg
About Us
ePrep Home Page